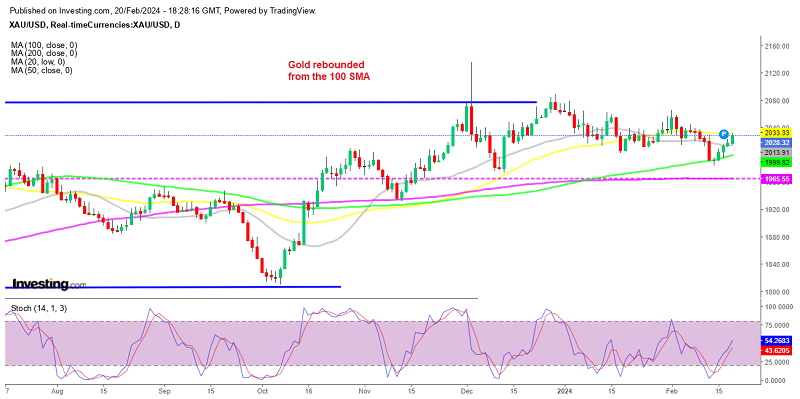
After hitting a low of $2,031 last week, gold has seen a rebound off the 100-day simple moving average (SMA). However, the climb was halted as the price failed to break through the 50-day SMA. This indicates that there is some resistance at this level, and it will be important to monitor how the price reacts in the coming days.
Gold’s movement in relation to these SMAs can provide valuable insight for traders and investors. The 100-day SMA is often used as a long-term trend indicator, showing the overall direction of the market. In contrast, the 50-day SMA is a more short-term indicator, reflecting recent price movements.
The failure to surpass the 50-day SMA suggests that there may be some selling pressure in the market at this level. Traders will need to monitor whether gold can overcome this resistance and continue its upward trajectory. Additionally, the interaction between these two SMAs can also signal potential shifts in market sentiment and strength of the trend.
Overall, the rebound off the 100-day SMA indicates some bullish sentiment, but the inability to surpass the 50-day SMA shows that there are challenges ahead for gold’s price movement. This dynamic interplay between the SMAs underscores the importance of technical analysis in understanding the underlying trends in the gold market.


