- Gold prices supported by rate cut expectations and central bank buying.
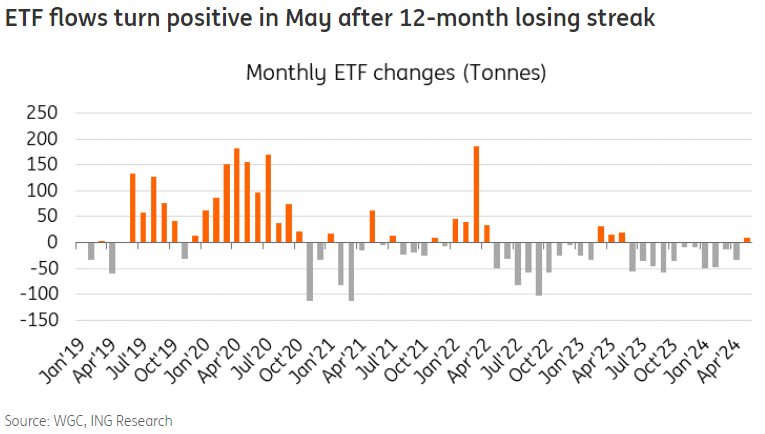
- Gold ETFs see positive flows, suggesting bullish momentum.
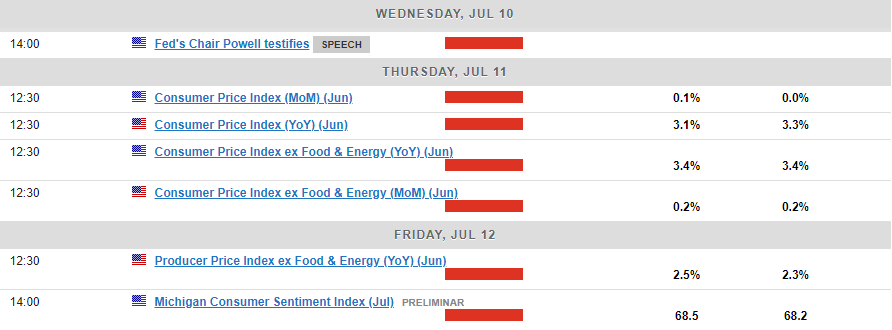
- Fed Chair Powell’s testimony and may cause short-term volatility but no direction.
MOST READ: Oil Price Update – Oil Prices Fall as Gaza Talks and Hurricane Beryl Take Center Stage
Gold prices found support at $2350 per ounce yesterday after a selloff erased Friday’s gains. On Friday, gold peaked at $2393 per ounce as the market assessed the impact of the US jobs report and adjusted their expectations for a rate cut.
Last week, a series of weak US economic data led to significant downward revisions of last month’s Non-Farm Payroll (NFP) figures. This prompted market participants to increase their bets on a 25 basis points rate cut in September, with the probability rising to 77% from 60% at the start of the week.
US Interest Rate Probabilities, July 9, 2024
Source: LSEG
As markets grapple with medium- and long-term direction, gold remains a central focus. Based on Friday’s response, could a rate cut be the key catalyst for gold to break through the $2400 per ounce mark and maintain levels above it?
Historically, gold prices tend to perform better when interest rates are low. Given the current rate environment, it is surprising that a deeper price correction has not occurred since the beginning of the year. This resistance to a significant correction amidst low rates may indicate underlying strength in the gold market, hinting at a potential upward breakout.
Central Banks Gold Buying
Central banks had been on a buying spree this year, which many had attributed to the elevated prices. The recent World Gold Council (WGC) survey indicates that central banks are expected to continue their gold purchases. While the absence of the People’s Bank of China (PBoC) from the gold market in June caused a temporary dip, overall central bank buying is anticipated to remain steady.
The WGC survey suggests that central bank gold purchases will stay robust, signaling continued support for gold prices in the near future. Additionally, the market will be keen on monitoring the PBoC’s re-entry into the gold market for potential price movements.
The positive outlook for gold is further reinforced by the increase in global ETF flows, hinting at a sustained bullish trend in the precious metal market.
Gold ETF Flows in May After 12-Month Losing Streak

Source: WGC, ING Think
These factors indicate that the current bull run in gold may have plenty of momentum left, with strong support from central bank buying and positive ETF flows.
US Inflation and Fed Chair Powell Testifies
Fed Chair Powell has started a two-day visit to Capitol Hill, where he will testify before Congress. The Fed Chair is expected to answer questions on the economy, rate cuts, and overall monetary policy. While this may cause short-term volatility, it is unlikely to provide direction for precious metals.
Chair Powell’s testimony will conclude tomorrow, just in time for markets to brace for Thursday’s US CPI data release. This month’s report is particularly significant given the recent spate of weak economic data from the US. A further decline in inflation would heighten expectations for a September rate cut.

For all market-moving economic releases and events (GMT-Time), see the MarketPulse Economic Calendar. (click to enlarge)
Technical Analysis
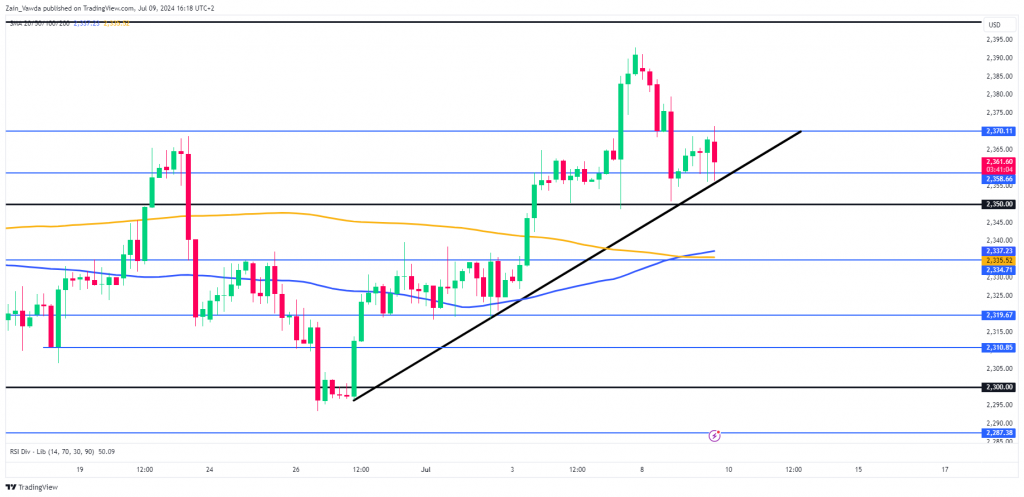
The H4 gold chart below illustrates a staircase pattern with higher highs and higher lows since bottoming out around $2293/oz. Gold approached the ascending trendline yesterday and made another attempt today.
Counteracting a potential break lower is the golden cross pattern, which suggests bullish momentum. Additionally, the positive trend in gold prices is supported by central bank buying and positive ETF flows, indicating a strong foundation for further price increases.
A break below the trendline would need to navigate the moving averages before the $2300 level becomes relevant. There are also intraday support areas between $2350 and $2300 that could attract buying pressure.
Support
- 2358
- 2350
- 2334 (200-day MA)
Resistance
- 2370
- 2379
- 2390
- 2400 (psychological level)
Gold H4 Chart, July 9, 2024

Source: TradingView.com (click to enlarge)
Follow Zain on Twitter/X for Additional Market News and Insights x.com/zvawda
Content is for general information purposes only. It is not investment advice or a solution to buy or sell securities. Opinions are the authors; not necessarily that of OANDA Business Information & Services, Inc. or any of its affiliates, subsidiaries, officers or directors. If you would like to reproduce or redistribute any of the content found on MarketPulse, an award-winning forex, commodities and global indices analysis and news site service produced by OANDA Business Information & Services, Inc., please access the RSS feed or contact us at info@marketpulse.com. Visit to find out more about the beat of the global markets. © 2023 OANDA Business Information & Services Inc.


